Patients
The Patient Dashboard lets you search, view, create, and manage patient records. Open it from Tools > Patients in the sidebar.
This page requires the patient-viewer or patient-manager UI feature code. Users with patient-viewer can browse but not edit; patient-manager grants full access.
Dashboard Overview
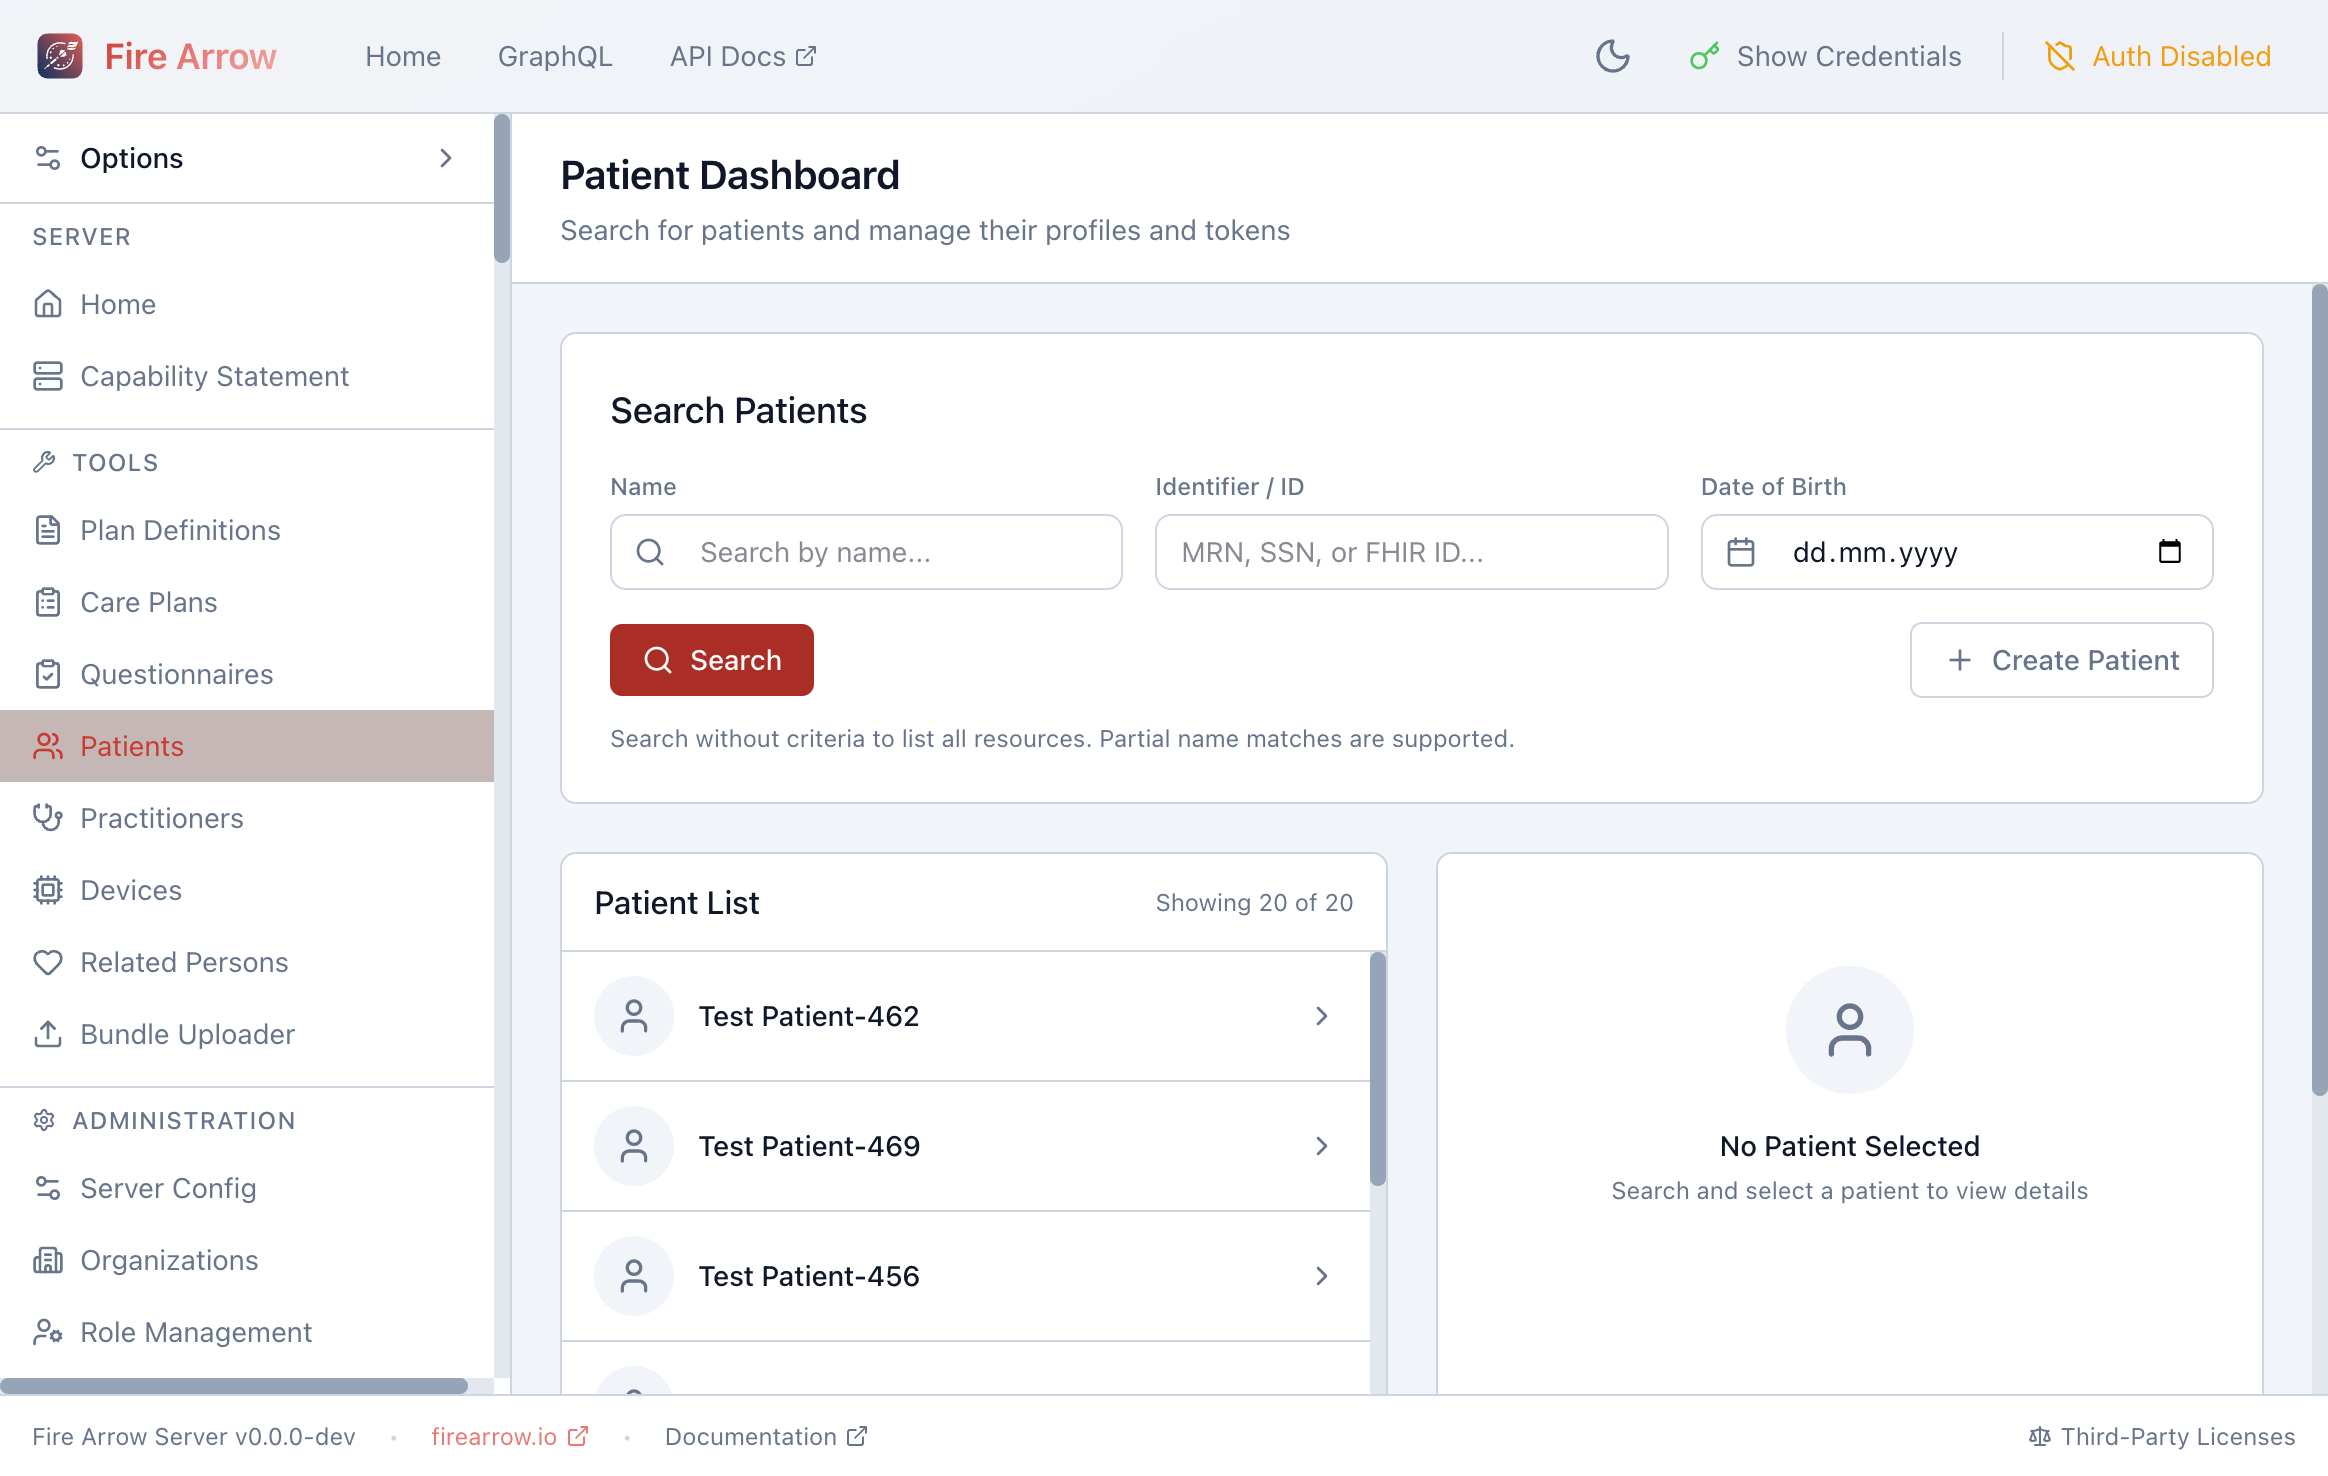
The dashboard is divided into three areas:
- Search panel at the top with filters for Name, Identifier / ID, and Date of Birth.
- Patient List on the left showing matching results.
- Patient Details on the right displaying the selected patient's information.
Searching for Patients
Enter search criteria in any combination of the available fields:
- Name - partial matches are supported (e.g. typing "John" will find "John Doe").
- Identifier / ID - search by MRN, SSN, or FHIR resource ID.
- Date of Birth - filter by exact date.
Click Search to run the query. Leave all fields empty and click Search to list all patients on the server.
Viewing Patient Details
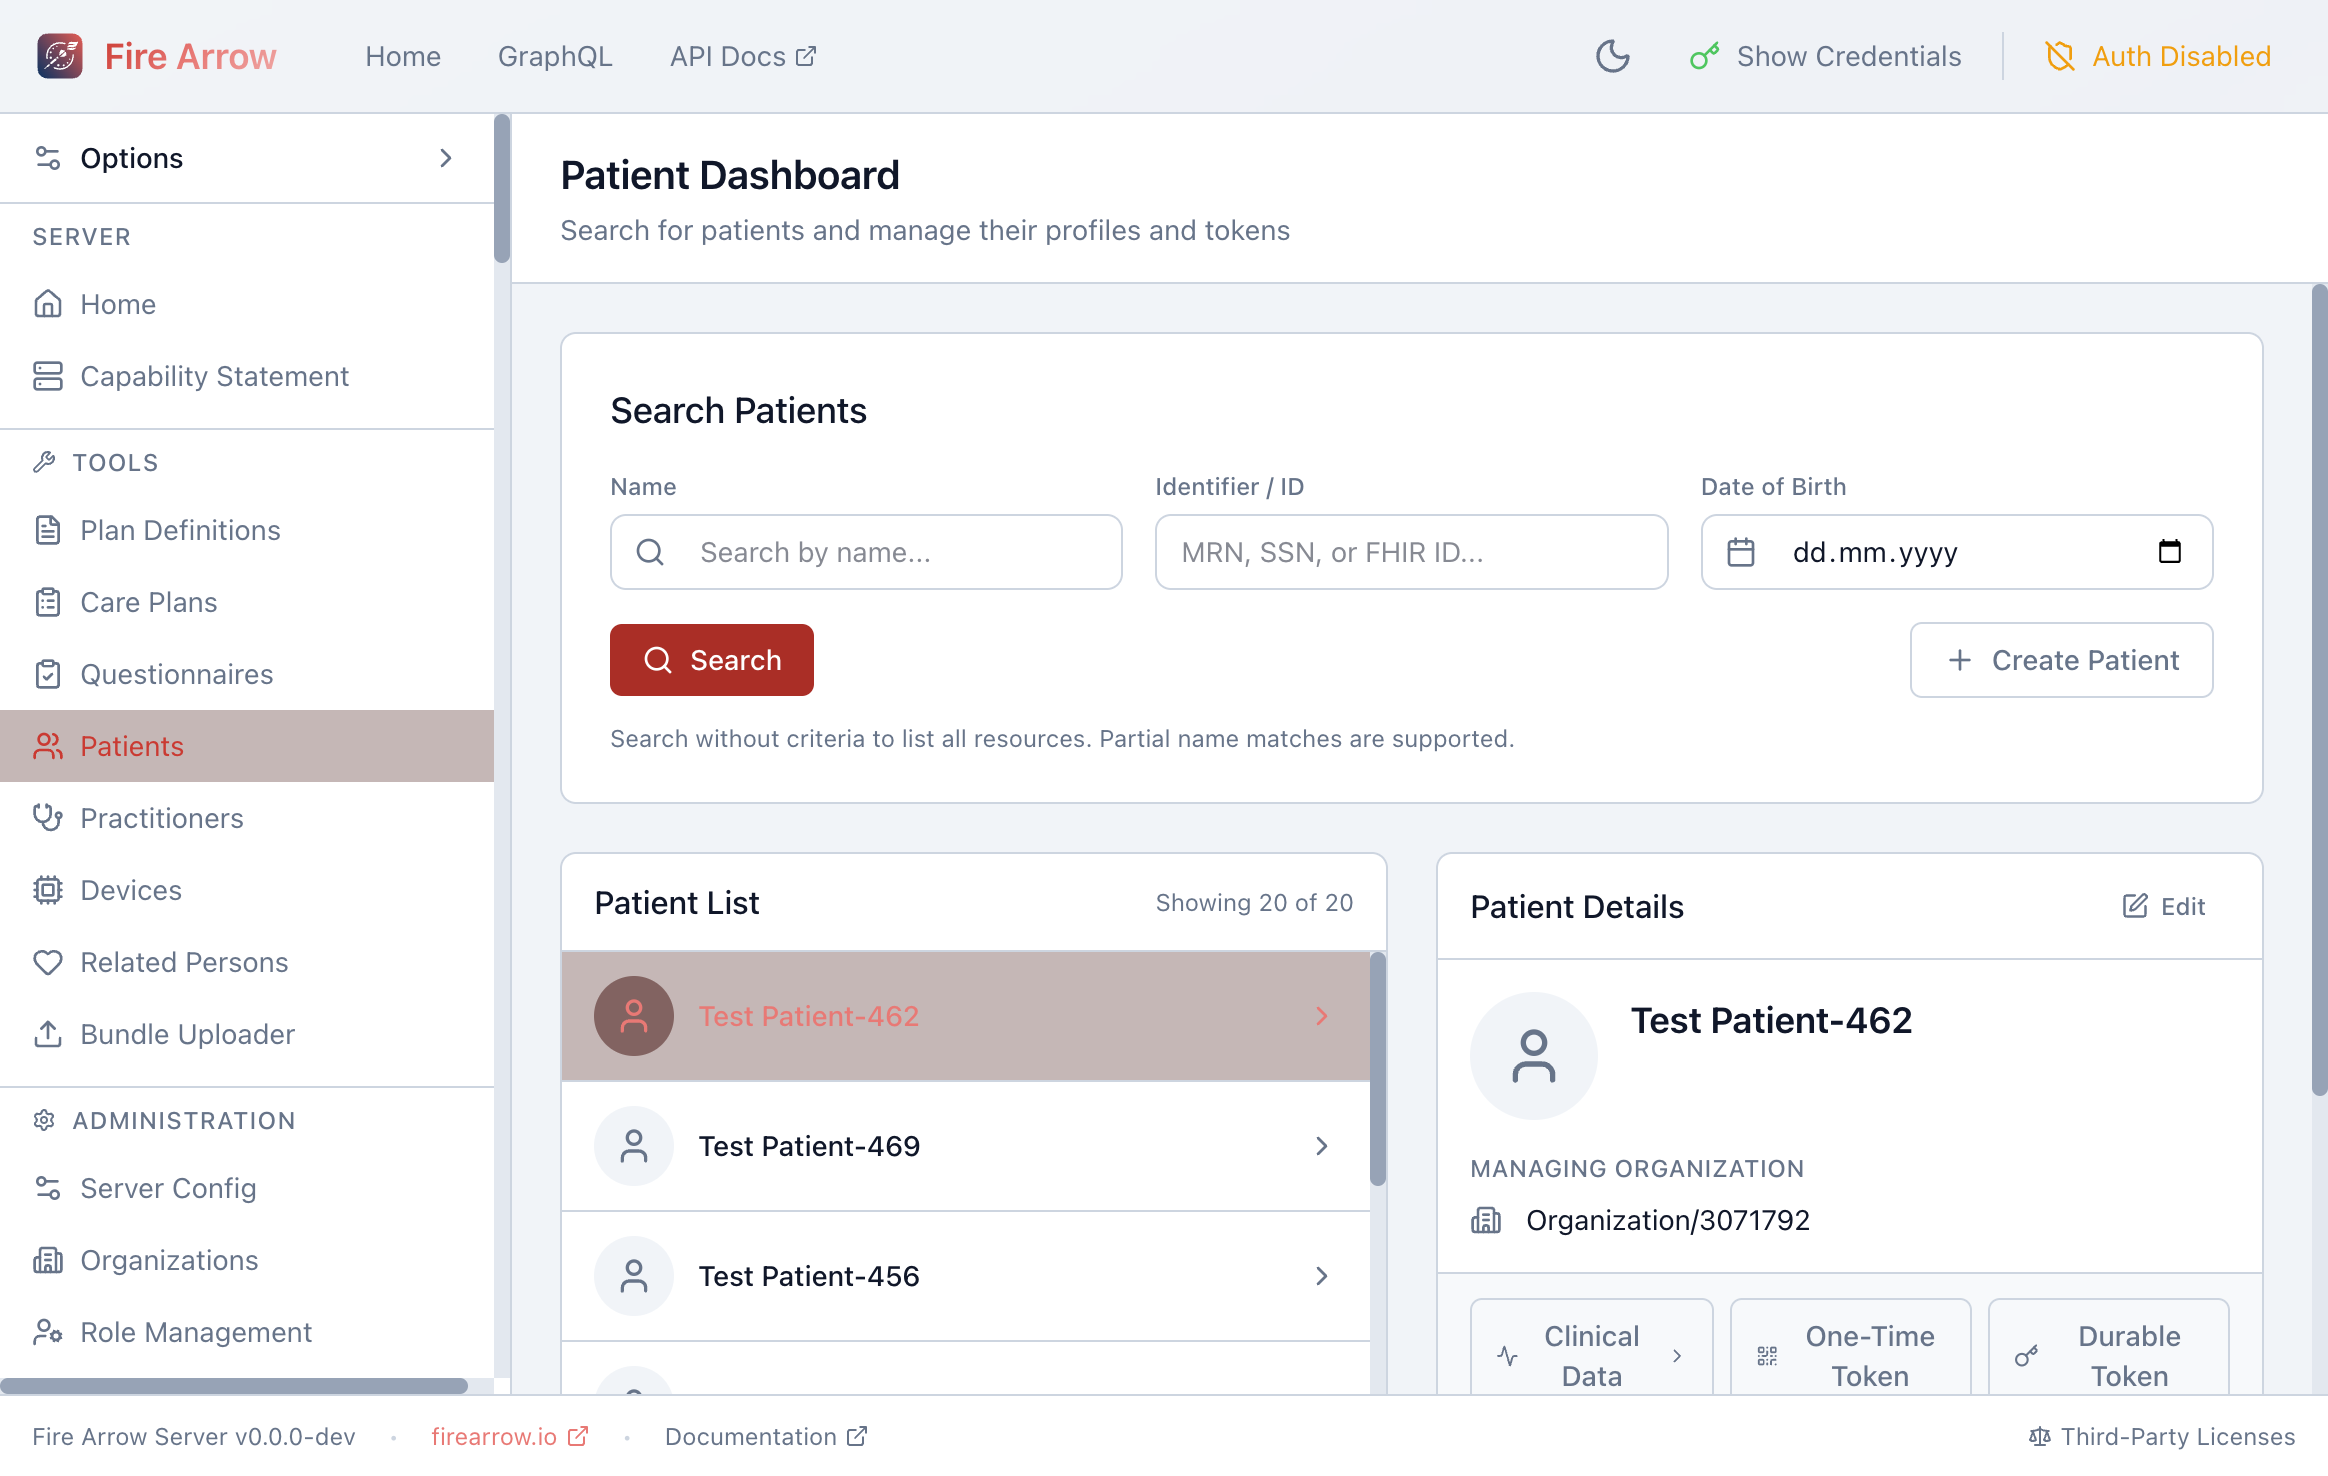
Click a patient in the list to open their details on the right. The detail panel shows:
- Patient name and avatar
- Managing Organization - the organization responsible for the patient record.
- Action buttons:
- Edit - opens the patient editor to modify demographics.
- Clinical Data - navigates to the patient's clinical timeline, showing conditions, observations, medications, and other clinical resources over time.
- One-Time Token - generates a single-use API token scoped to this patient, displayed as a QR code and copyable string.
- Durable Token - generates a long-lived API token scoped to this patient.
Creating a New Patient
Click + Create Patient in the top-right corner of the search panel. A form will appear where you can enter:
- Given name and family name
- Date of birth
- Gender
- Identifiers (MRN, SSN, etc.)
- Managing organization
After filling in the required fields, click Save to create the patient resource on the server.
Editing a Patient
Select a patient from the list and click Edit in the detail panel. The same form used for creation opens pre-filled with the patient's current data. Make your changes and click Save.
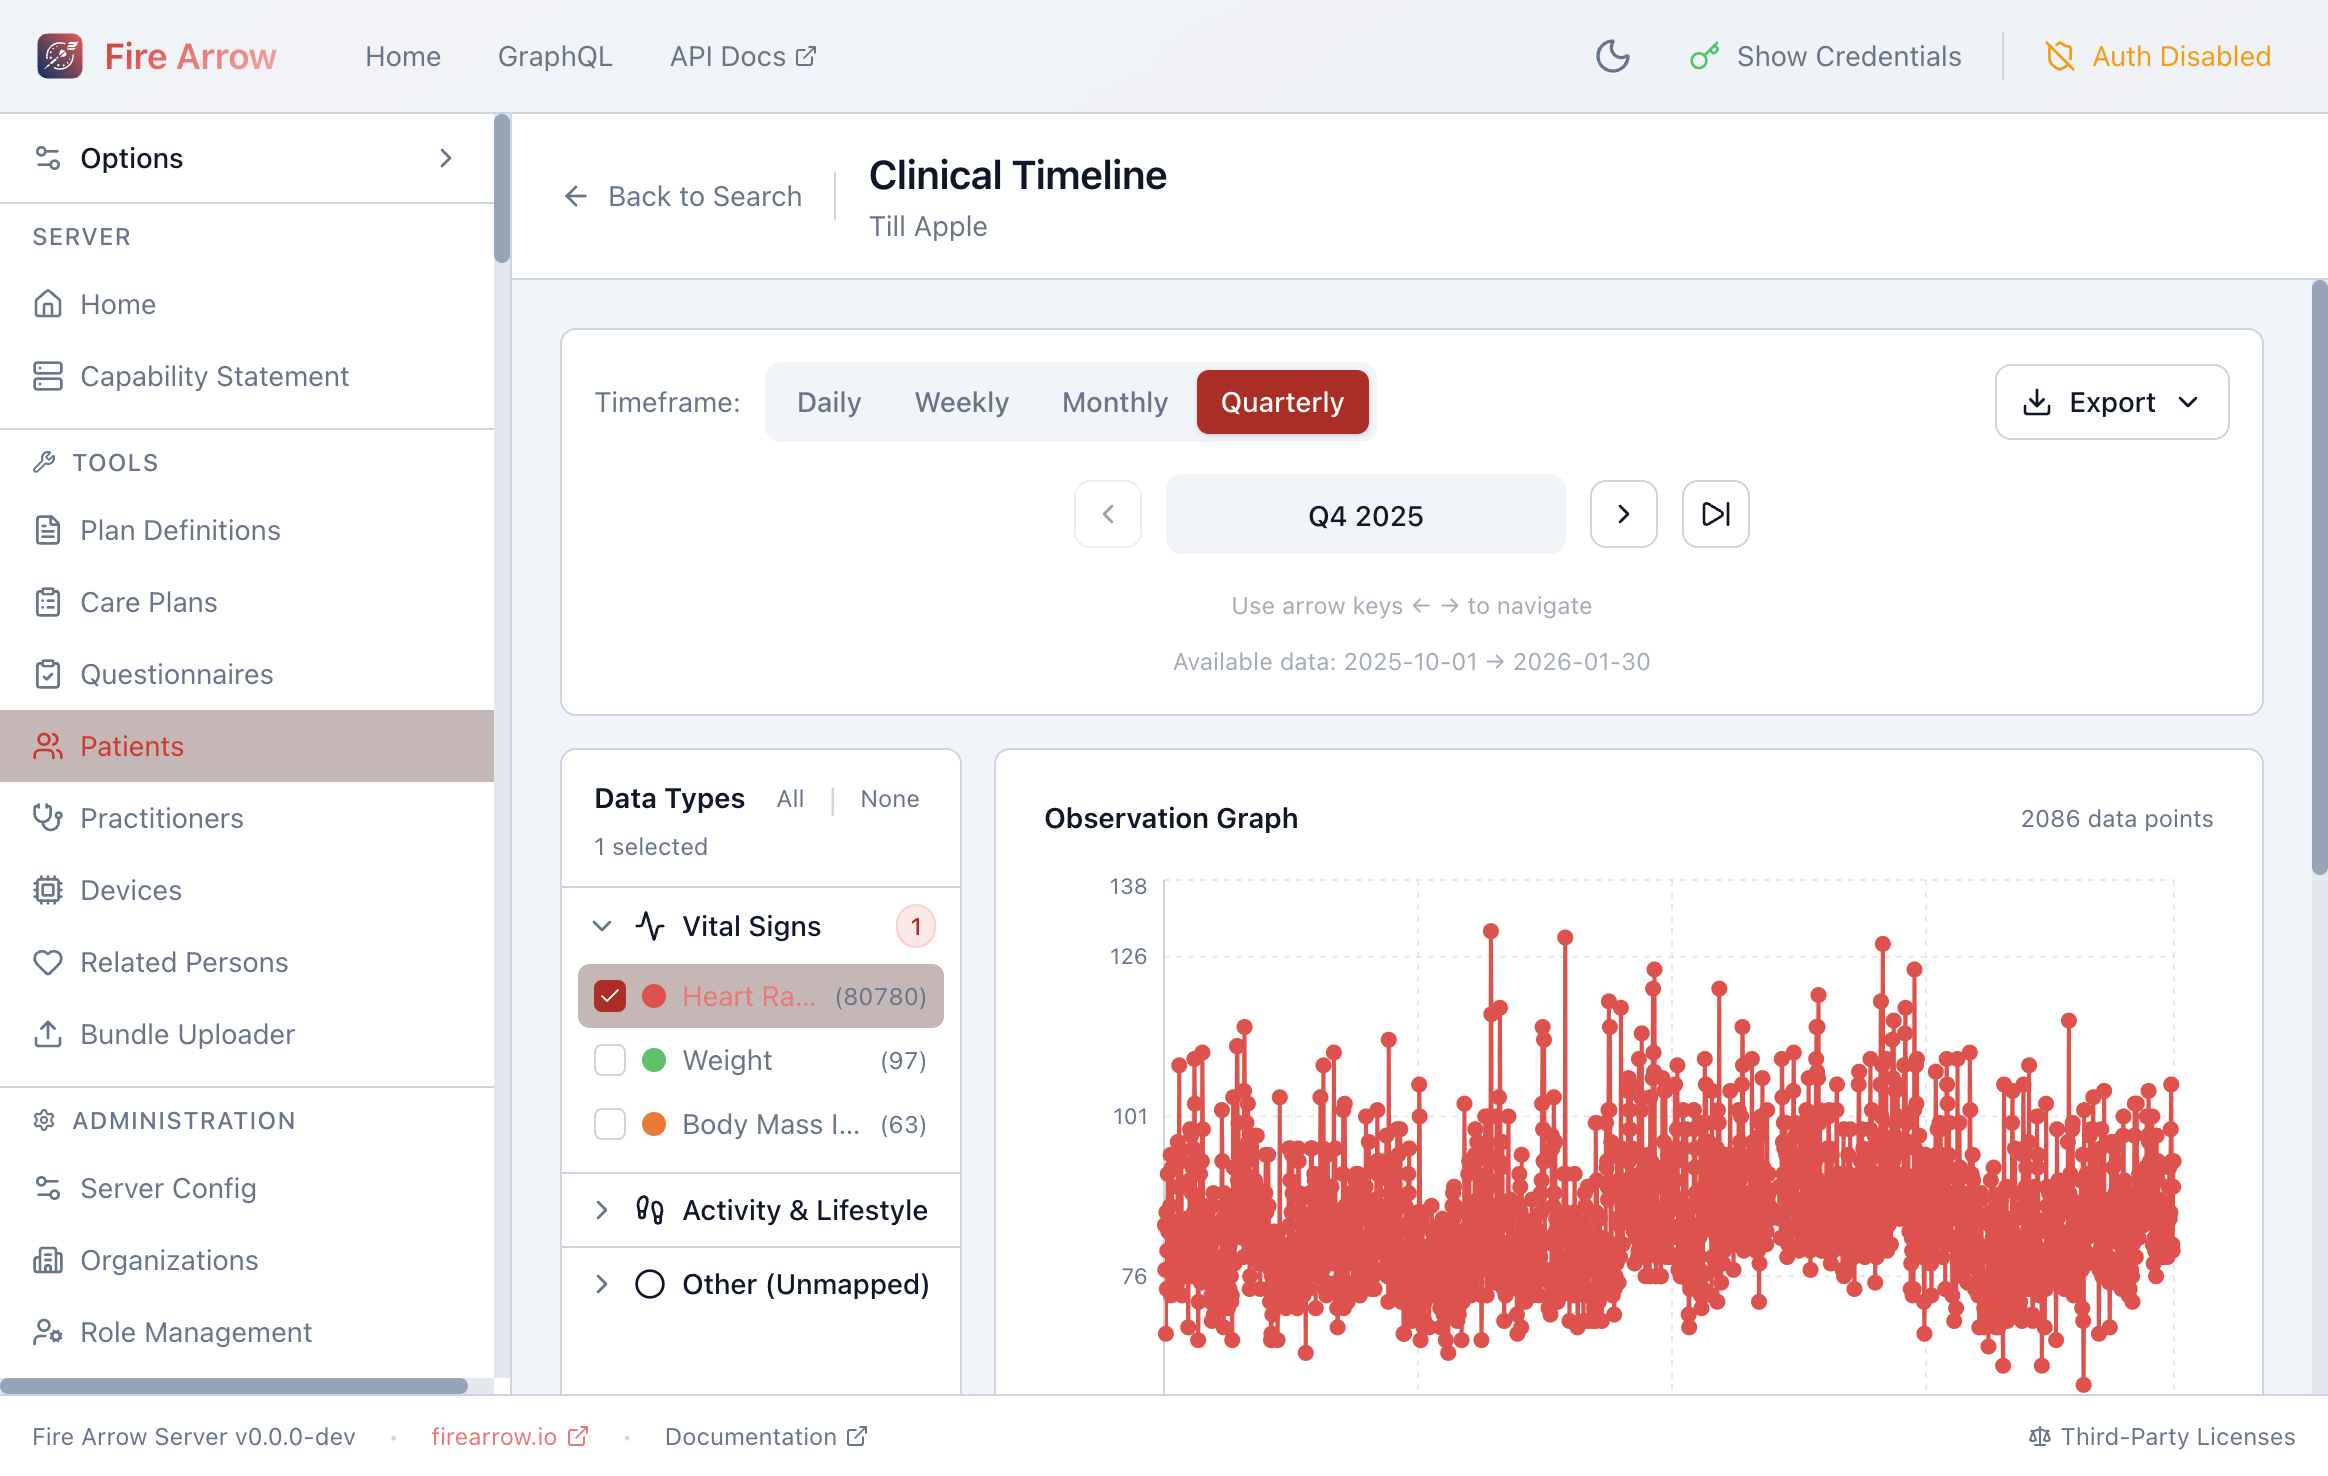
Clinical Data
Click Clinical Data on a selected patient to open a full-page view of their clinical history. The view loads all available clinical data for the patient and presents it in two complementary ways: time-series graphs for numeric observations and a structured event timeline for discrete clinical events. Whatever has been captured for the patient - whether high-frequency device readings, periodic lab results, or one-off procedures - will appear here.
Layout
The Clinical Data page is divided into three areas:
- Header bar - shows the patient's name, a Back to Search button, timeframe controls, and an Export menu.
- Data Types sidebar (left) - lists all available observation types, grouped by category, with checkboxes to select which series to graph.
- Main area (right) - shows the Observation Graph at the top and the Event Timeline below it. A Data Summary card in the sidebar provides counts at a glance.
Time-Series Data (Observation Graph)
Numeric observations are displayed as interactive line charts. Select one or more data types from the sidebar to plot them on the graph. Each data point represents a single FHIR Observation resource with a numeric value.
The sidebar groups available data types by clinical category:
| Category | Example data types |
|---|---|
| Vital Signs | Heart Rate, Respiratory Rate, Body Temperature, Systolic BP, Diastolic BP, Oxygen Saturation, Body Weight, Body Height, BMI, Head Circumference |
| Laboratory | Hemoglobin, Hematocrit, WBC, Platelets, Fasting Glucose, HbA1c, Sodium, Potassium, Creatinine, eGFR, Cholesterol, HDL, LDL, Triglycerides, ALT, AST, TSH, Free T4, and many more |
| Activity & Lifestyle | Sleep Duration, Steps, Physical Activity |
| Other (Unmapped) | Any observation codes not in the built-in catalog still appear here, so you never lose data |
Each data type shows the number of data points available next to its name, making it easy to see at a glance where the richest data lies.
The graph supports:
- Multiple series - select several data types to overlay them and spot correlations (e.g. heart rate and oxygen saturation together).
- Tooltips - hover over any data point to see its exact value and timestamp.
- Legend - identifies each series by colour.
Structured Data (Event Timeline)
Below the observation graph, the Event Timeline shows discrete clinical events as coloured markers on a horizontal track. These events are extracted from the following FHIR resource types:
| Event category | Source resource | Examples |
|---|---|---|
| Medications | MedicationRequest, MedicationStatement | Prescriptions started, changed, or stopped |
| Procedures | Procedure | Surgeries, biopsies, imaging procedures |
| Conditions | Condition | New diagnoses, resolved conditions |
| Encounters | Encounter | Office visits, hospital admissions, telehealth sessions |
| Immunizations | Immunization | Vaccines administered |
| Diagnostics | DiagnosticReport | Lab panels, imaging reports, pathology results |
| Questionnaires | QuestionnaireResponse | Completed patient questionnaires and assessments |
Each event category has a distinct colour and icon. When many events occur close together in time, they are clustered into a single marker showing the count - click a cluster to expand and inspect individual events.
Click any event marker to open a detail panel that shows structured information about the event: dates, status, type-specific fields, and (for questionnaire responses) the full set of answers.
The event timeline and observation graph share the same time window, so you can see how clinical events (like a medication change or a procedure) correlate with changes in the patient's vital signs or lab values.
Navigating Time
Use the Timeframe controls in the header to adjust the time window:
| Granularity | What it shows |
|---|---|
| Daily | A single day of data - useful for high-frequency readings like continuous heart rate monitoring. |
| Weekly | One week of data. |
| Monthly | One calendar month. |
| Quarterly | Three months - the best starting point for getting an overview of recent trends. |
Navigate between periods using the previous and next buttons, or click Jump to latest data to snap to the most recent time window that contains data.
The header also displays the available data range (e.g. "Available data: 2025-10-01 to 2026-01-30") so you know the full extent of the patient's history.
Filtering Events
The event timeline supports category filtering - toggle individual event categories (medications, procedures, conditions, etc.) on or off to focus on the events you care about. Use the All and None buttons for quick bulk selection.
Data Summary
The Data Summary card in the sidebar shows:
- Total number of observation data points in the current time window.
- Total number of clinical events.
- The date range of available data.
Exporting Data
Click the Export button in the header to download the patient's clinical data. Available formats include:
| Format | Contents |
|---|---|
| Observations (CSV) | Tabular export of the selected observation series - ready for analysis in a spreadsheet or statistical tool. |
| Clinical Events (CSV) | All structured events in tabular form. |
| FHIR Bundle (JSON) | The raw FHIR resources as a Bundle - useful for importing into another system or for programmatic analysis. |
| Patient Summary (Text) | A human-readable text summary of the patient's clinical data. |
| Print Summary | Opens a print-friendly version of the summary in the browser. |
By default, exports cover the current time window. Uncheck Export selection only to export the patient's full history - the system will fetch any data not yet loaded before generating the export.
In-Browser Analytics Engine
The Clinical Data view uses an in-browser analytics engine (powered by DuckDB) to query and aggregate observation data locally. This means:
- Data is loaded in monthly chunks as you navigate, with adjacent months prefetched for smooth scrolling.
- Large datasets (tens of thousands of data points) are handled efficiently without requiring round-trips to the server for every view change.
- All processing happens in your browser - no patient data is sent to external analytics services.
Generating Access Tokens
The One-Time Token and Durable Token buttons generate API tokens that are scoped to the selected patient. These are useful for:
- One-Time Token - temporary access, for instance to share with a patient via QR code so they can complete a questionnaire on their own device.
- Durable Token - long-lived access for background integrations or mobile apps that need persistent access to a specific patient's data.
Both token types display a QR code and a copyable token string that can be used as a Bearer token in API requests.